
The Client's Data
The data used was supplied by an interested client, and describes the E.G.R. system in a car. The data consists of upstream pressure , downstream pressure
, mass flow through the system
and the area of a valve
.
Below the conditions of the engine are shown we see that the torque are RPM cover a wide range of states and so we can test our methods over the varying states.
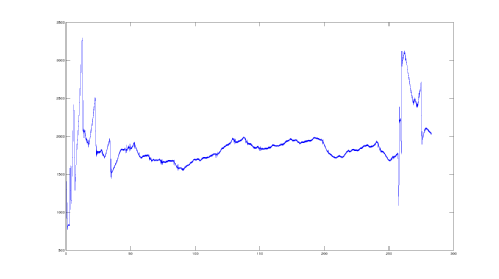
This is the engine RPM.
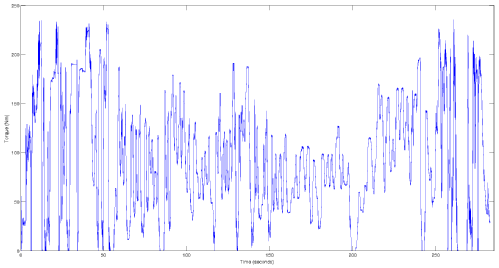
This is the engine torque.
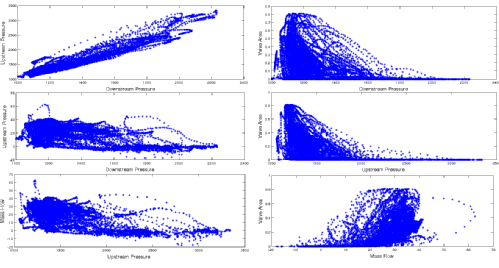
These are the coordinate projections of the input data.
The coordinate projections show the relationships between the different data streams, and as one can see, there is very little relationship between all of them, apart from between the two pressure values, where there is roughly a linear relationship between them. One notes further that the data seems to only cover subsections of the domain so there seems specific areas where engine operations seem not to occur. This will need to be considered in our choice of basis functions in our application.