Linear Interpolation
Interpolation is the process where one has a collection of data which is taken from some function
and one creates an approximation of the entire function by assuming the function to be linear, or a certain function, between these points. For simplicity, only linear interpolation is considered.
To evaluate the function at a point , the process is as follows:
- Find amongst
, the
points
that are closest to
such that
- Calculate the hyperplane spanning those points
- Calculate the value at the evaluation point on this hyperplane.
The advantage of this method is the simplicity and speed of the computation of the interpolation. However, due to the fact that the method assumes that the values of the data given are the truth, if the noise in the measurement of the data is significant with regards to its data, then the interpolation will be poor.
If the function to be interpolated is twice differentiable, the error associated to the interpolation is of the order of the second derivative in magnitude, and so for a function that fluctuates wildly, this will be very large. This result is a consequence of Rolle's theorem.
In the situation where the order of magnitude of the variance of the noise is much smaller than the magnitude of the values of the data, linear interpolation is suitable since the noise will not affect the interpolation values so much.
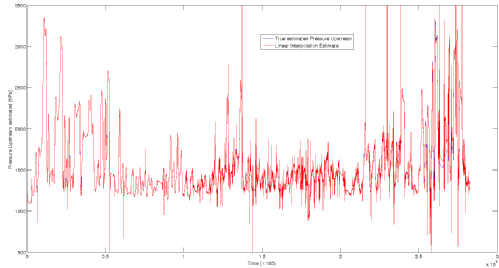
A First Look at the Results
The figure below shows an interpolation where we have taken one in every 4 points in the first 10000 data points and used this as an approximation for the rest of the data. This produces a much more noisy collection of the data, but one can still see the general trend of the data, except for the final 5000 data points.
One also observes in the figure that there are points that the interpolation predicts excessively large values, uncharacteristic within what one can see to be the case. This is due to the fact that we have noise in the system, so the interpolation is affected by this.