Verifying the new cell with DNA
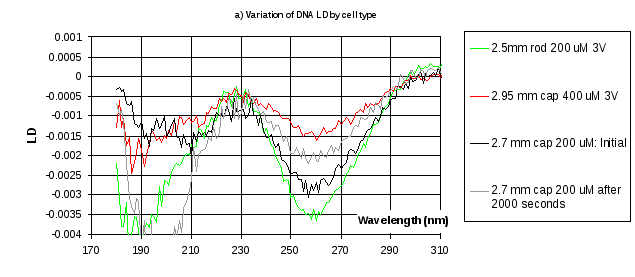
Figure 7 compares LD results of using laboratory stock DNA obtained using an LD cell with a conventional quartz inner rod and the new nested capillary configuration, using inner capillaries with ODs of 2.95 and 2.7 mm. It was apparent that when using the 2.95 mm capillary the DNA concentration had to be doubled to 400 μM to obtain a reasonable amplitude signal, and this was still 40% of the signal obtained with the rod (Figure 7a). Results using the 2.7 mm capillary were approximately 80% of those from the traditional cell, suggesting that it would be capable of producing equivalent results to those obtained using a central quartz rod, and that it is to be preferred over the 2.7 mm OD capillary.


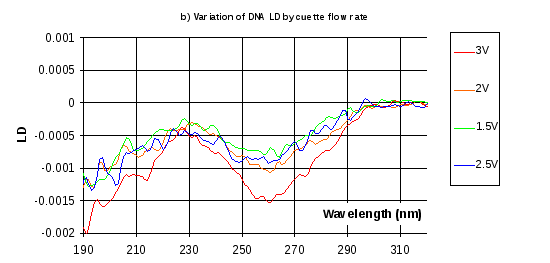
Figure 7 Comparison of LD measurements with different cell types. a) DNA LD spectra using central rod and inner capillary with two different diameters. 2.7 mm capillary results given before and after a 2000 second run. b) DNA LD at various motor voltages from 3V to 1.5V, which determine the Couette rotation rate. Tests done in the order 3V,2V 1.5 V and 2.5V
The 2.95 mm OD capillary was used to measure the LD variation with Couette flow rate, as set by the applied motor voltage (Figure 7b). The first three measurements were with descending motor voltages, which will result in descending Couette flows, and the LD amplitude dropped accordingly as expected. For the final measurement the voltage was raised to 2.5V, and the amplitude of LD spectra was less than had previously been obtained using a 2V motor voltage. If conditions were stable, the expected result would have been larger than the result previously obtained at 2V. Such reduction in LD amplitudes over time were consistently seen when making measurements using the 2.95 mm OD inner capillary, prompting a more detailed investigation of the variation of LD with time.

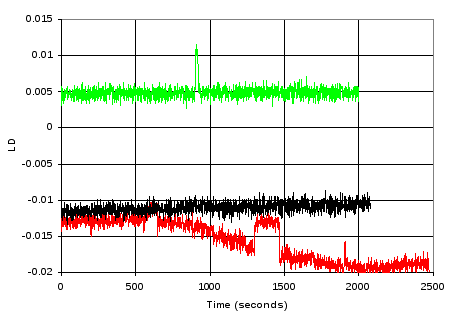
Figure 8 LD variation with time at 260nm for 2.5 mm rod (Green), 2.95 mm OD inner capillary (red) and 2.7 mm inner capillary (black). Short duration shifts in value result from capillary rotation being stopped.
Figure 8 shows that while results with the reference cell are stable over time, the LD signal with the 2.95 mm capillary showed a significant drift downwards after 10 minutes. The 2.7 mm capillary showed a slight drift upwards, but nothing as significant as the 2.95 mm capillary. It was frequently observed with the 2.95 mm OD capillary that the fluid would disappear during the period when measurements were being performed, which would be one cause of the poor measurements that had been obtained. These results also suggest that the 2.7 mm OD capillary is to be preferred over the 2.95 mm OD capillary.
Problems using the air-locks
The technique of using air locks to separate the reactants and to minimise the amount of reactants required has been used successfully, although the air locks were not 100% reliable. This was partly because there was some variability in size of the airlocks, and sometimes, especially when the lock was relatively small, the fluids would run along the surface of the tube past the airlock.
