
Semiconductors in Magnetic fields
The application of magnetic fields is one of the more powerful methods for investigating the properties of charge carriers. It was first shown by Landau in 1930 that the energy levels of a population of free electrons will become quantised into a set of magnetic sub-bands (landau levels). These levels are separated by the cyclotron frequency, with energies given by
where wc =eB/m* is the cyclotron frequency and k|| is the component of the wavevector parallel to the magnetic field.
Towards the bottom of each Landau level, the density of states develops a series of singularities known as Van Hove singularities. This divergence is often expressed in a parabolic approximation
The two expression above are depicted in the figure below.
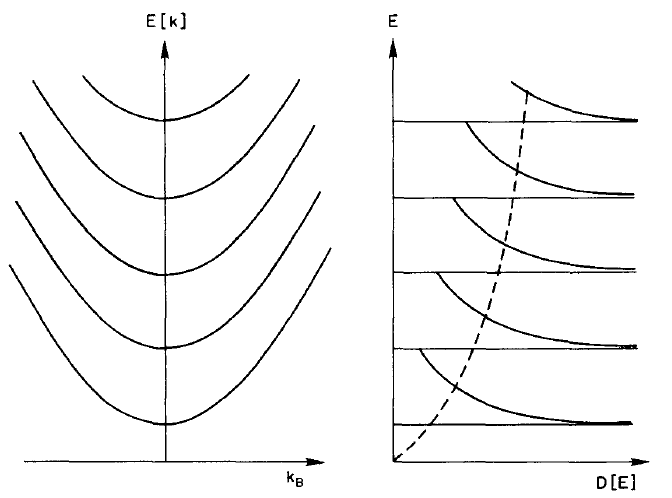 Figure 1: (left) The Landau dispersion as a function of wavevector along the magnetic field direction. (right) The density of states as a function of energy.
If the energy separation between two of the levels (hwc) is equal to a well defined energy, such as the optic phonon energy, resonant absorption and emission of phonons will take place. This is known as the Magnetophonon effect and lead to the spectrum shown in figure 2.
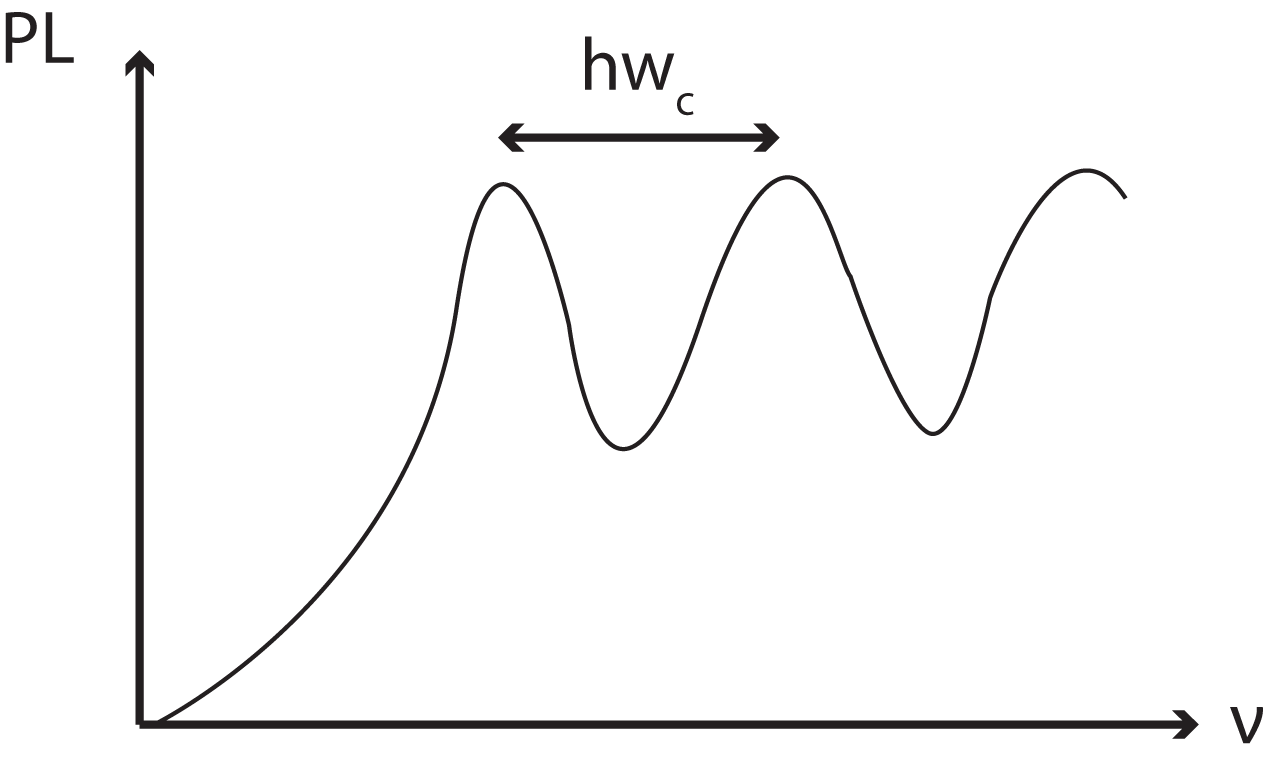 Figure 2: A sketch of a photoluminescent spectrum illustrating the magnetophonon effect. The distance between subsequent peaks is given by the energy spacing of the landau levels.
At low temperatures, in degenerate materials, conduction takes place within a small region around the Fermi energy. As the magnetic field is varied, the singularities at the bottom of each Landau level cross the Fermi level in succession, and thus give rise to a series of structures in the resistivity which are periodic in 1/B.
The first experimental demonstration of this effect was the observation by Shubnikov and de Haas of small oscillations in the magnetoresistance of bismuth. These become known subsequently as Shubnikov de Haas oscillations and are shown in Figure 3.
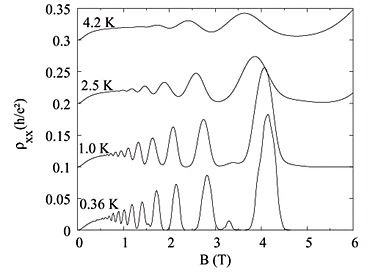
Figure 3: Experimentally observed SdH oscillations. Taken from J. P. Freire et al, Braz. J. Phys. 34 (2004)