
Angle-resolved photoelectron spectroscopy
As with UPS, ARPES uses low energy photons in the ultraviolent range to probe the valence states of a solid. However, in addition to the number of emitted photoelectrons and the binding energy of the initial electron state, the angular dependence of the photoelectron distribution is also probed. A simple schematic of the ARPES concept is shown in Figure 1.
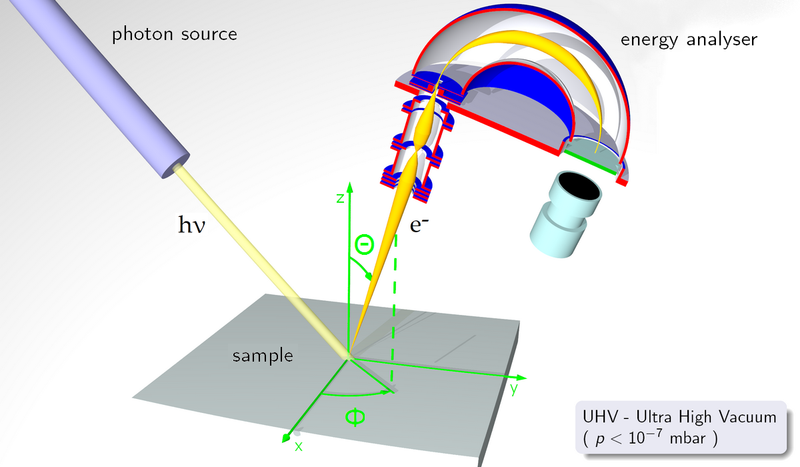 |
| Figure 1: Schematic of the ARPES concept, notice that with a moveable analyser both in-plane and out-of-plane rotation can be achieved. Image source: http://en.wikipedia.org/wiki/File:ARPES.png |
In the simplistic one-step model of ARPES, the incoming photon gives up its energy to an electron which then escapes from the material. The probability for this process, and hence the strength of the signal received, is related to the initial and final state wavefunctions of the electron. There has to be an N-body initial wavefunction, the wavefunction of the energy in the unperturbed lattice system, and an N-1-body final state wavefunction, representing the loss of the electron. Additionally there is the requirement for wavefunction extension into the vacuum, as the photoelectron is escaping, and overlap into the crystal, to account for the interaction between the initial and final states. Additionally, we require that energy and momentum are conserved according to the following relations
which is typical for a photoemission process.
In order to determine the angular, and therefore the momentum, distribution of electrons within the system we first must have a properly ordered single crystal. By analysing the signal strength for a given acceptance angle in the detector, and recording the kinetic energies of the detected electrons, their momentum can be determined.
Initially, from the kinetic energy, we know that
The components of the momentum parallel and perpendicular to the surface can then be resolved from the angle of the detector.
From this we can determine the dispersion relations between momentum and the binding energy of the system. As a result we can plot the band structure of a material and compare it to theoretical calculations. (Above reproduced in part from [1])
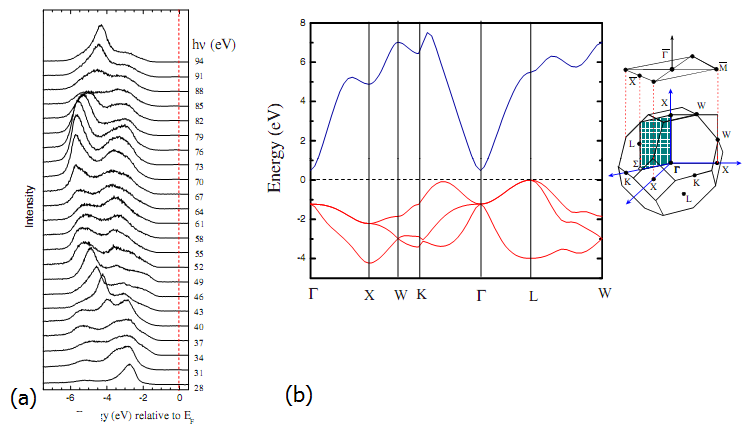 |
| Figure 2: (a) ARPES spectra of CdO at varying angles (b) the corresponding quasi-particle corrected band structure and Brillouin zone |
Figure 2 shows an example ARPES plot. The position of the peaks relative to the Fermi level in Figure 2(a) and the angles they occur at provide the shape of the valence bands (in red) in Figure 2(b). The band structure has been corrected for quasi-particle effects as real systems often suffer from large correlation effects, mostly in the form of electron-electron interactions. In the case of CdO it features a large electron accumulation layer due to the low minimum in the conduction band at Γ. In order to fully model and determine the initial/final states of the electron properly, many-body perturbation theory is required.
References
[1] A. Damascelli, Physica. Scripta., 109 (2004), 61-74
[2] L. F. J. Piper, Leyla Colakerol, P. D. C. King, A. Schleife, J. Zùñiga-Pérez, Per-Anders Glans, Tim Learmonth, A. Federov, T. D. Veal, F. Fuchs, V. Muñoz-Sanjosé, F. Bechstedt, C. F. McConville, and Kevin E. Smith, Phys. Rev. B 78, 165127 (2008)