
Photoluminescence
Photoluminescence (PL) is the spontaneous emission of light from a material following optical excitation. It is a powerful technique to probe discrete energy levels and to extract valuable information about semiconductor sample composition, quantum well thickness or quantum dot sample monodispersity.
An electron that has been excited above the conduction band of a material will eventually fall and recombine to the hole that has been excited below the valance band after losing some energy through releasing a phonon to the lowest available non-radiative energy level. The efficiency of photoluminescence signal is determined by the the nature of optical excitation, properties of material; i.e. radiative and non-radiative recontamination and defects.
Experimental Technique
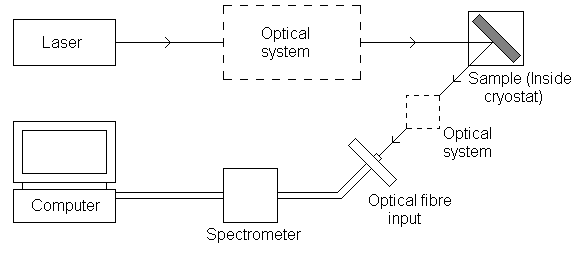 Figure 1: Diagram of PL experiment set-up
A laser tuned to a wavelength close to the bandgap energy of the sample is directed onto the sample. This may be held in a cryostat to facilitate measurements being taken at low temperatures. A rapidly pulsing laser can be used as a quasi constant beam laser since measurements are taken continuously. When the laser beam is incident on the sample, photoluminescence occurs and light is emitted from the sample at wavelengths dependent on the sample composition. The sample is oriented such that the reflected laser beam and the PL emission propagate in different directions.
The emitted light is directed into a fibre optic cable and then into a spectrometer. A filter may be placed in front of the fibre input to remove any incident laser light. Inside the spectrometer, a diffraction grating diffracts different wavelengths in different directions towards an array of photo-detectors that measure the intensity of each wavelength component. The digital information is interpreted by the computer, which can display a PL spectrum. The spectrum indicates the relative intensities of light of different wavelengths entering the detector.
PL Spectrum
An example of an experimentally obtained PL spectrum is shown in figure 2. The peak intensity occurs at a wavelength of 365nm, which corresponds to a photon energy of 3.4eV, the accepted energy width of the bandgap of wurtzite GaN.
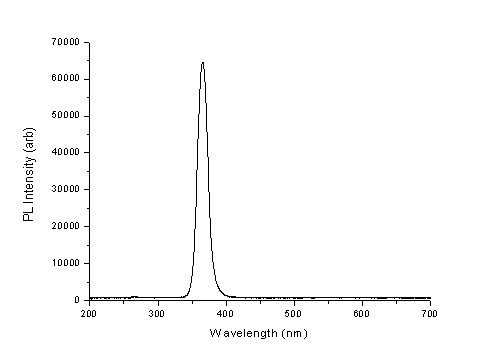
Figure 2: PL Spectrum for a template sample of wurtzite structure GaN excited by a 266nm laser
Time Resolved Photoluminescence (TRPL)
Time resolved photoluminescence (TRPL) is a technique that allows the variation in sample PL intensity in response to a laser pulse to be measured over time. The apparatus used is similar to that of standard PL with some differences. The spectrometer is replaced with a monochromator that only selects light of a single wavelength to be directed into a photomultiplier detector capable of single photon counting. The wavelength selected will correspond to that of PL emission from the sample as identified using conventional PL measurements. The CCD input into the computer is also connected to a detector near the output of the laser source, which is used as a trigger for measurement.
Laser pulses of ~150fs duration fired at MHz frequency are used in TRPL. On leaving the laser, the pulse acts as a trigger for measurement to begin at the CCD input. Once it is incident on the sample, the pulse will induce PL emission, whose intensity will decay over time before the next pulse hits. The photon count arriving at the detector over short time intervals is recorded, allowing the computer to plot a light intensity decay curve for light of a particular wavelength. The curves for subsequent pulses are summed together in order to improve signal to noise ratio. The decay time of the sample PL can give information about processes taking place within. An example of a PL decay curve obtained experimentally is shown in figure 3. The laser pulse excites a rapid increase in PL intensity, which then decays away more slowly over several nanoseconds.
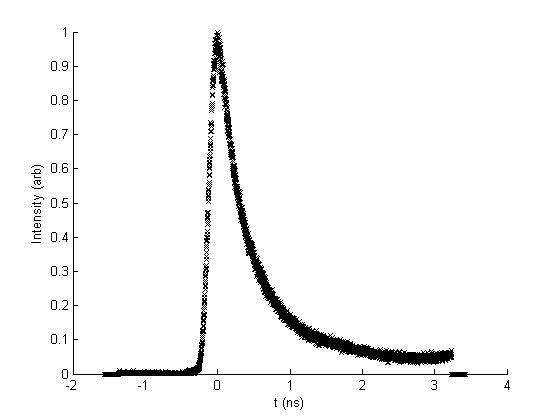
Figure 3: PL intensity decay curve obtained by TRPL for a sample of cubic Al0.6Ga0.4N excited by a 150fs pulse 210nm laser
References:
- Gfroerer T., H. Photoluminescence in Analysis of Surfaces and Interfaces. In Encyclopaedia of Analytical Chemistry; Meyers, R. A., Ed.; John Wiley and Sons Ltd.: Chichester,pp 9209-9231, (2000)