
Raman Spectroscopy
Raman spectroscopy is a type of optical spectroscopy that can be used to look at excitations present in a sample. In semiconducting materials it is commonly used to look at phonons and plasmons. It is a complementary technique to IR spectrometry.
The technique is conducted by illuminating the sample with laser radiation (Usually IR Visible or UV), this light interacts with the sample and can be shifted from its original frequency. The elastically scattered light equal to incoming wavelength is filtered out and the inelastically scattered light is passed into a spectrometer to produce a spectrum. Only a small fraction (1 in 10 million) of the incoming photons are inelastically scattered.
An energy level diagram showing the Raman processes is shown in figure 1.
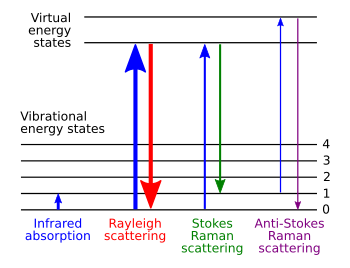
Figure 1. Energy levels of Raman processes. From [1]
There are two processes contributing to a Raman spectrum Stokes and Anti-Stokes. Stokes is where the incoming laser light excites the sample to a virtual excited state and it then decays to a higher energy state than it started in, this produces a photon of lower energy of longer wavelength than the incoming laser. The other process is the opposite where the incoming light excites to a state which then decays to a state with lower energy than the original, this produces a photon upshifted in energy.

Figure 2. Example Raman spectrum of GaN the peaks at 381, 420 and 646 are from the substrate. [2]
It is common for Raman spectrums to be shown as Raman shift ie. difference from laser wavelength in wavenumber (inverse cm).
Experimental Considerations
In order to conduct a Raman experiment it is important to consider the Raman efficiencies are very small (sometimes 10-12)[3] therefore the following thigs are needed:
- A bright source of well monochromated light (given by a laser)
- An efficient optical system of capturing the scattered light
- A spectrometer with a high sensitivity detector.
A variety of lasers are used to give different wavelengths He-Ne, Nd:YAG, Ar+ and Kr+ this covers the visible and UV energy ranges.
The detection of scattered light by a spectrometer is difficult, the Raman signal is 4-6 orders of magnitude lower than the elastically scattered laser light and if shifted in frequency by about 1%. This detection is possible with modern spectrometers. Another consideration is the stray light rejection ratio, contributions to the signal from sources other than the one specified by the spectrometer. This stray light id caused by imperfections in the optics and scattering of the walls and gas inside the spectrometer. To reduce these problems the sample should be as smooth as possible reducing scattering of light, or the use of a double monchromator which can significantly improve the stay light rejection ratio.
Detection in modern spectrometers is obtained using CCDs sometimes coupled to a amplifying system such as a micro-channel plate.
References
[1] Wikimedia file http://en.wikipedia.org/wiki/File:Raman_energy_levels.svg
[2] FREITAS, JR., J.A. and MOORE, W.J.. Optical Studies of Undoped and Doped Wide Bandgap Carbide and Nitride Semiconductors. Braz. J. Phys. [online]. 1998, vol.28, n.1
[3] P.Y. Yu and M Cardona, Fundametals of Semiconductors, 4th Ed. Springer, New York. 2010.