
Atomic Force Microscopy (AFM)
Introduction
AFM has been employed in a variety of research fields including physics, chemistry, biology and engineering. In order to measure the force or potential energy between a small tip and a sample, a tiny probe called a cantilever is employed. The cantilever provides a force sensor and a force actuator. By pushing the cantilever to the sample, its topographic height can be measured, and the interacting force between the tip attached to the cantilever and the sample can be measured by pulling it. There are various methods for detecting the motion of the cantilever with nanometre scale accuracy. These include tunneling current measurement , optical deflection technique , fiber interferometry and piezoresistive methods.[1]
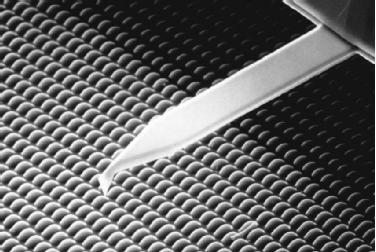
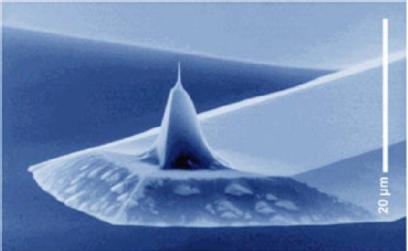
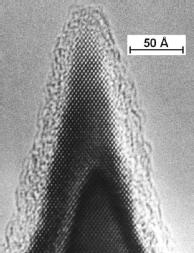
Fig1. SEM and TEM images of a micromachined silicon cantilever with an integrated tip pointing in the [001] crystal direction.
Interacting forces
With AFM, one can measure the force between atoms at the tip and the sample which are located as close as 0.1–100 nm. The forces can be classified into attractive and repulsive forces. For attractive forces, van derWaals (vdW) interaction, electrostatic force and chemical force are included. The chemical forces are described by many different theoretical models. Among them, we can mention Morse potential, Stillinger–Weber potential and Tersoff potential [2]. The repulsive forces can be considered as hard sphere repulsion, Pauli-exclusion interaction and electron–electron Coulomb interaction. In general, the repulsive forces are very short-range forces and have an exponential decaying or inverse power law with highorder distance dependence.
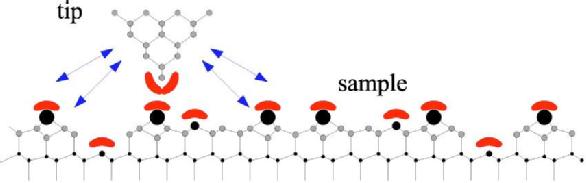
Fig1. Schematic view of an AFM tip close to sample. Chemical short range forces act when tip and sample orbitals overlap. Long range forces originate from surface of tips are indicated by arrows.
The forces which interact at atomic scale, have been classified as short- or long-range forces, attractive or repulsive. When a tip is located in the proximity of the surface the existing interacting forces are superposed. AFM senses interactions like capillary forces, covalent forces, electrostatic forces, common repulsive interaction forces, van der Walls forces, etc. When the surface of the scanned material has hydrophilic properties, strong tendency is manifested toward water molecules adsorbtion. In ambient condition, a thin water layer is formed on the surface in the shape of a meniscus, causing attractive forces called capillary forces.
The covalent forces, met especially in semiconductive materials, are defined as short-range chemical forces (0.1-0.2 nm, F=3-9 nN), that tightly bind the atoms put together to form a molecule. If a potential difference is applied between the tip and the sample, both supposed to have conductive characteristics, a charge up is registered and electrostatic forces are detected. In the case of the ionic crystals, the anions and cations exert a short-range electrostatic force. At the atomic level of any kind of material, when the atoms are very close to each other, short range repulsive forces are manifested, explained by hard sphere repulsion, Pauli exclusion interaction and electron-electron Coulomb interactions. Their strength decays exponentially with the increasing order of separation. For neutral atoms, it can be talked about van der Waals forces, based on the coulomb interaction. They are caused by fluctuations in the electric dipole moment of atoms and by their mutual polarization. In case that, the sample and the tip are manufactured from the same material and/or vacuum is the working environment, van der Waals forces exert always an attractive action. Their disturbing large magnitude can be dramatically reduced by using liquids as experimental ambience.
Some general specifications regarding the force activity can be listed. Typically, the interatomic force value for the solid bulk has a constant in a range of 10-100 N/m. The short-range forces contribution is used to image the atomic arrangements with high resolution. For 10-100 nm distance between probe and substrate, the influence is received only from long-range forces, such as van der Waals, electrical and magnetic forces. If the experimental investigations are done on a clean , electrically neutral and non-magnetic surface, only the van der Waals forces have contribution for drawing an image plot. Electrostatic, magnetic and meniscus forces can be eliminated by equalizing the electrostatic potential between tip and sample, using nonmagnetic tips or operating in vacuum. Working in the dynamic mode, the long-range forces can be attenuated by proper choice of the cantilever’s oscillation amplitude. The attractive forces lead to a decrease of the resonant frequency, while the repulsive components cause an increase of the mentioned parameter value.
Modes of operation
There are three basic modes of operation with an AFM: contact mode, non-contact mode and tapping mode.


The AFM operation modes have been developed with the time, based on the experimentalists experienced demands and needs. The simplest mode is the contact mode, also called static, the second main group of modes, named dynamic, can be divided into noncontact and intermittent contact modes, allowing the collection of measurements for amplitude, frequency or phase.
The static mode is done in “contact” with the scanned surface, where the overall force is repulsive, both long- and short-range forces adding up to the imaging signal. The cantilever tip is dragged over the substrate maintaining the deflection at a constant order. The force can be estimated according to Hooke’s law, from the detected variations of the cantilever bending, the displacement being the only controllable parameter. In the static mode, both tip and sample can be subject to deformation, showing risks regarding collision. Easier handle is assured for low stiffness cantilevers. They need to be much softer then the substrate atoms connecting bond. The realisation of qualitative experimental results is not trivial, even hard, but the physical interpretation of data is not at all complicated. The drawn image is definite a map, presenting the topographic view of the scanned area z(x,y,F=ct). As regarding the atomic resolution, weather the visualized atoms arrangements are true and reliable, there still are controversial discussions, being considered that the acquired configuration must be a superposed interaction of many atoms.
The dynamic mode gets its name from the fact that, the cantilever is deliberately vibrated at or close to its resonance frequency and, to allow external excitation for its oscillation, is mounted on an actuator. The vibrating energy seems to be stored by the system, leading to large and maximum orders for the amplitude.The resonance of the cantilever is characterized by amplitude, phase and frequency. The variation of these three indicators, due to the interaction force, can be measured and the force will be evaluated from the above registered signals, through a theoretical formalism.Obtaining atomic resolution in the dynamic mode proved to be difficult in ambient conditions.
The earliest AFMs, in noncontact mode [3], were operated with low amplitudes (below 1nm) for cantilever vibration. The amplitude signal was fed into the feedback electronics and the shift was adjusted and recorded to create an image of the substrate. The cantilever was levitated above the surface during the scan process. Later, technical improvements have been done to the instrument [4], implementing a new functioning mode called tapping mode or intermittent contact mode. Working at large amplitudes (above 100 nm) applied to stiff cantilevers (k=40 N/m), the system has been created to bypass the problems induced by meniscus formed due to the adsorbed water layer. The cantilever is oscillated to come in contact with the surface cyclic and to receive enough restoring energy to detach. The method proved to be gentle, for example, overscanning single molecules for hours their conformation doesn’t change.
To make a detailed extension of the dynamic working modes, the system permits flexible switch between the parameters recorded to model the map of the surface. It can be talked about amplitude modulation [3], which includes phase imaging, and frequency modulation, where the phase-locked loop electronics can be added.
When the measurements are done using the amplitude modulation, either the vibration amplitude or the phase of the cantilever is controlled by a feedback signal, while the exiting frequency remains fixed. The numerical changes for the amplitude or phase are registered and calculate for the tip-sample distance estimation. This mode is capable to do material or particles discrimination by using the variations in the phase of oscillation. The amplitude modulation procedure works well both in noncontact and intermittent contact mode, but, in vacuum ambience doesn’t manage to respond fast enough, meaning instantaneously, to the changes in tip-sample interaction.
Frequency modulation [5] is used for measuring the cantilever resonance frequency, while the amplitude remains constant. The resonance frequency shift instantaneously produces changes in the exciting frequency. The numerical order of the amplitude influences the imaging process, large values, comparing to atomic distances, lead to qualitative results, while low amplitudes cause sensing mainly for short-range forces. Surfaces have mostly been atomic resolved in the frequency modulation mode at low temperatures in UHV.
Phase-locked loop (PLL) [6] is an incorporated electronic circuit, used together with the frequency modulation mode. PLL offers precision and uniformity for the imaging signals. Its functioning principle is rather simple. Using a negative feedback, the frequency or the phase of an input signal can be adjusted by lowering or raising the order to fit to a previous set value. The output signal order is, therefore, the difference between the collected signal and the reference preset value. The output signals are recorded for imaging the surface map.
Force spectroscopy is an important additional application of AFM. The recorded data generate a graphic, indicating how the force magnitude is ranged as a function of tip-sample distance. The interpretation of the force versus distance curves leads to conclusions about the involved interaction forces of any kind. The spectroscopic analysis allows indirect discrimination of single atoms of different type. The method suggested to distinguish between various atoms or molecules, consists of force measuring for each expected type. It can be clearly seen that the interaction magnitude varies from weak to very strong for different species.
In the static mode the spectroscopic data are acquired by applying to the sample a movement along z – direction, approach and retract, while the cantilever deflection is kept under observation. This mode facilitates a straightforward interpretation of the found characteristics. However, the graphic has not a monotonic trend, but shows hysteresis loops, attributed to jump-to-contact and jump-off-contact phenomena. Noncontact AFM brings advantages for the spectroscopic field. Quality of experiments is definitely improved by increased sensitivity, stable force measurements and low thermal noise. Low temperature ambience is recommended for obtaining performance in experiments. Spectroscopic results in amplitude modulation mode are acquired by recording the evolution of the cantilever amplitude with the tip-sample distance variation. The data will be translated into a force versus distance plot. Frequency shift measurements are preferred to dc forces recording because they assure high accuracy and low noise. In the second case, large noise, lateral and vertical thermal drift can prevent the accuracy of spectroscopic experiments.
References
[1] Yongho Seo, Wonho Je; "Atomic force microscopy and spectroscopy", Rep. Prog. Phys. 71 (2008) 016101 (23pp).
[2] Giessibl, F. J. (2003). "Advances in atomic force microscopy." Reviews of Modern Physics 75(3): 949.
[3] Y. Martin, C.C. Williams and H.K. Wickramasinghe, J. Appl. Phys. 61 (1987) 4723-4729.
[4] Q. Zhong, D. Innis, K. Kjoller and V.B. Elings, Surf. Sci. 290 (1993) L688-L692.
[5] T.R. Albrecht, P. Grutter, H.K. Horne and D. Rugar, J. Appl. Phys. 69 (1991) 668-673.
[6] A. Kikukawa, S. Hosaka, Y. Honda and R. Imura, Japan. J. Appl. Phys. 33 (1994) L1286-L1288.