X-Ray Diffraction
X-rays have photon energies in the range 100ev - 100Kev. In structural characterisation, mainly short wavelenght x-rays are used, with a range of 10>0.1 angstoms. X-rays are typically produced by synchrotron radiation or by x-ray tubes. X-ray tubes are the main source used in laboratory x-ray instruments. Synchrotron facilitys are far more expensive to use, but give improved results due to being more than a thousand times more intense than x-ray tubes.
When a x-ray beam hits the sample, it interacts with electrons in the atoms. Some photons in the incident beam will be deflected away from their original path. The deflected photons with unchanged wavelength have been elasticaly scattered (photons not lost energy), it is these photons that are measured in diffraction experiments since they hold information about the electron distribution in the material.
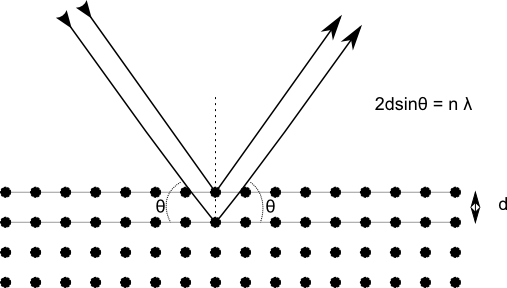
The peaks generated in x-ray diffraction are related to the atomic distances by braggs law.
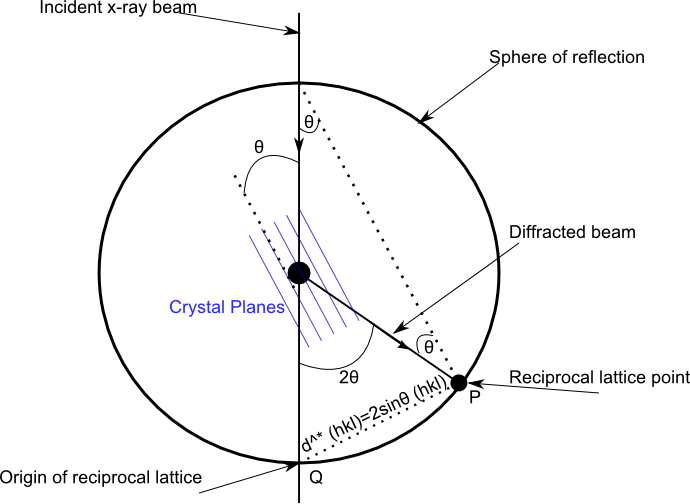
Ewalds Sphere
The relationship between the crystals reciprocal lattice, the x-ray wavelength and the angle of difraction for a given reflection can be demonstrated by a construct called Ewalds Spere. The center of the sphere is placed on the crystal and is given a radius of one reciprocal lattice unit. An x-ray reflection is produced each time a reciprocal lattice point cuts the sphere of reflection.
X-ray diffractometers
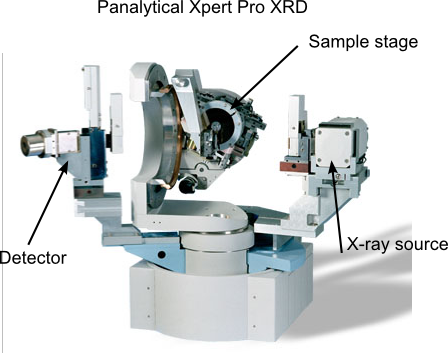
The picture below illustrates a modern x-ray diffractometer used in the department for structural characterisation of semiconductors.
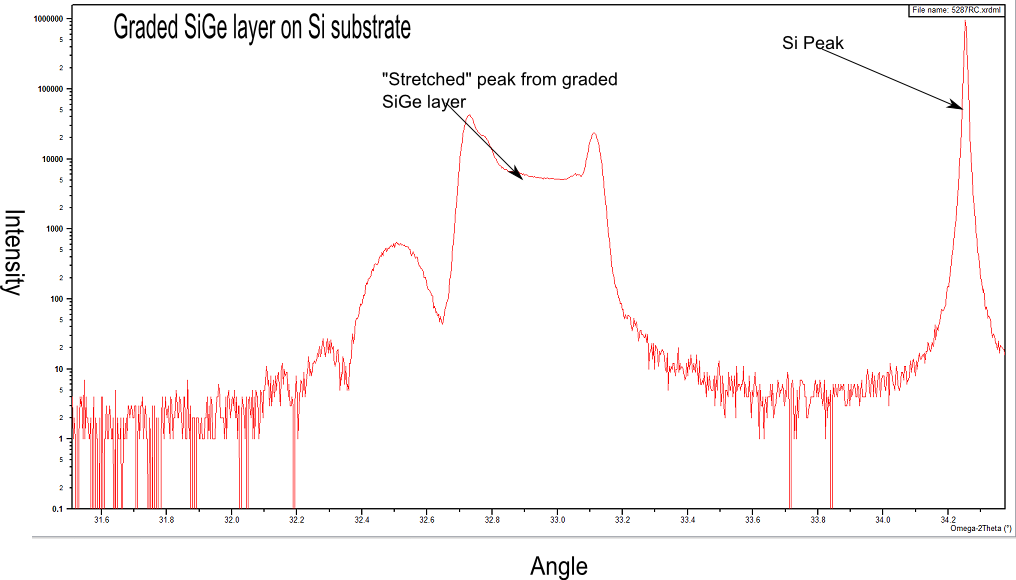
structural characterisation - rocking Curves
Much information on semiconductor structure can be inferred from a "rocking curve", including layer thickness, relaxation and composition. In a rocking curve the detector is fixed on the centroid position of a bragg peak and the detector is rocked over the bragg angle θ.
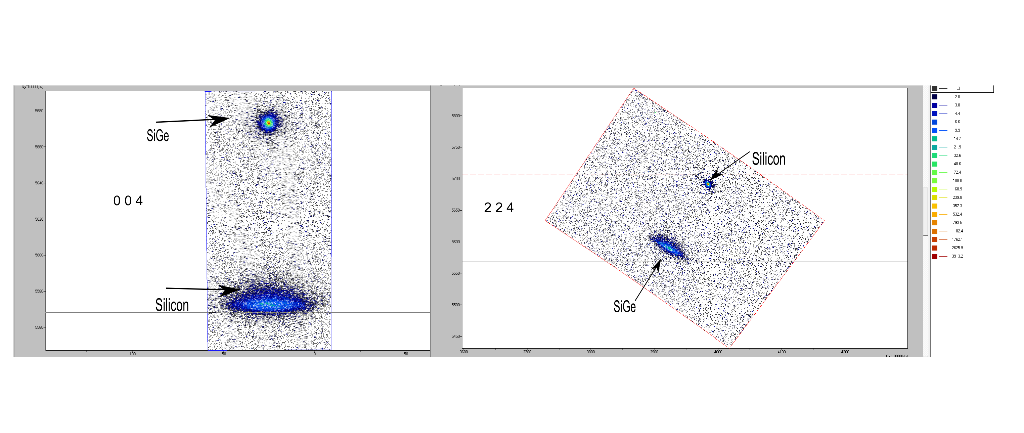
structural characterisation - Reciprocal Space Maps (RSM's)
RSM's are generated by taking lots of rocking curves over a range of