
SH Ultrasound - Why?
SH waves can be used in a wide variety of NDT applications, and this flexibility is due to the properties of this wave type.
What is an SH wave?
Shear horizontal (SH) waves are a class of shear waves. Shear waves oscillate in a direction perpendicular to the propagation direction of the wave front, in contrast to compression waves, which oscillate in a direction parallel to the propagation direction. Shear waves can be classified into those with vertical polarisation (SV), and those with horizontal polarisation (SH). Vertical polarisation means the oscillation is not only perpendicular to the propagation direction, it is also perpendicular to the sample surface. Horizontal polarisation means the oscillation is again perpendicular to the propagation direction, but it is in the same plane as the surface. SH waves are horizontally polarised shear waves. SV waves cannot travel along a surface which is free to oscillate (the boundary conditions instead require a Rayleigh-Lamb wave to be generated), although they can propagate within the sample, whereas SH waves can travel along such surfaces and within the (bulk) sample. SH waves are actually classified as guided waves, where a guided wave can be loosely defined as ultrasound propagating in any structure that affects the propagation properties. In this case, depending on the sample and the propagation distance, the waves are either guided by the structure, or they can propagate freely as with standard shear and compression waves.
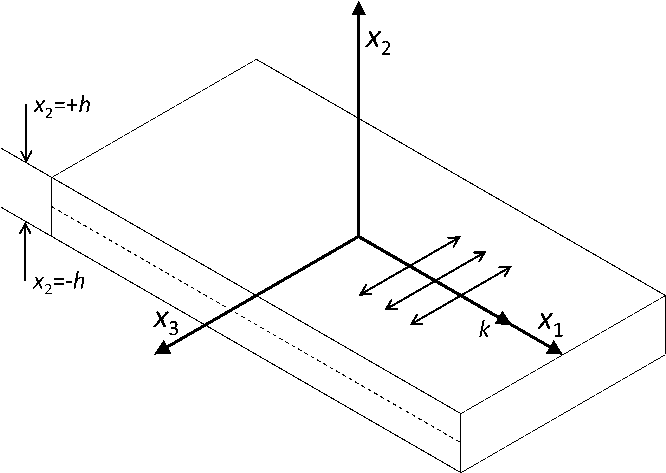
This picture depicts the in-plane oscillation direction (x3) of an SH wave relative to the propagation direction (x2). The displacement through the thickness (x1) of the sample will vary depending on the SH wave mode.
What is the dispersion curve?
SH waves are classed as guided waves; they can be treated as bulk waves over shorter ranges (depending on the sample thickness) as the wave must propagate a significant distance before the guided wave form is properly established. Like many guided waves, SH waves are not limited to what is referred to as a single mode. Although each SH wave mode is horizontally polarised, its phase and group speed at a given frequency (for a fixed thickness) will vary from that of other SH modes, and the variation of the particle displacement through the sample thickness will also be different. The lowest order mode, SH0, has the same phase and group speed, and these speeds do not vary with frequency; this wave is described as dispersionless. Other modes, (SH1 and higher) do not have a phase speed and group speed that are equal, and these speeds vary with frequency; this is referred to as dispersion. There is a simple equation that describes this behaviour, and this can be used to plot curves of the phase and group speeds for a given frequency-thickness. The term frequency-thickness is used, as the dispersion is a dependent of both of these. If the thickness were fixed, the variation would only be with frequency, and vice versa. At higher frequencies, all the modes tend towards the SH0 speeds.
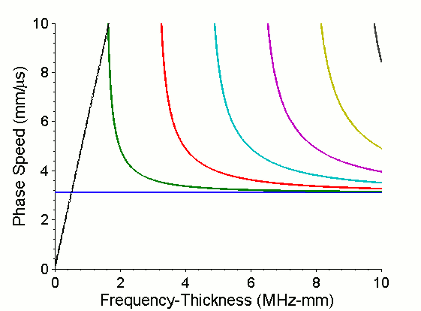
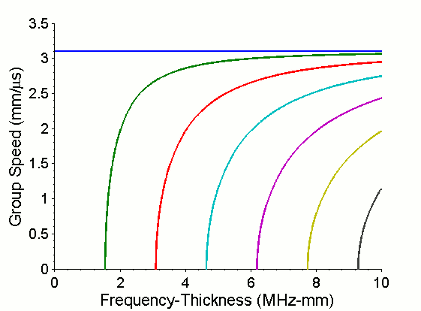
These pictures depict the phase (left) and group (right) speeds of various of SH wave modes. Shown are SH0 (blue), SH1 (green), SH2 (red), SH3 (cyan), SH4 (magenta), SH5 (yellow), and higher. SH0 exists at all frequencies, but other modes have cut-off frequencies below which they cannot exist in the sample. The diagonal black line intersecting the SH0 and SH1 modes on the phase speed plot shows the frequencies at which those modes will be generated, for a thickness of 1mm, and a wavelength of 6mm.
It is known that the amplitude and phase of certain modes can be more sensitive to defects under some conditions.
What are phase and group speeds?
Previously mentioned are the concepts of phase and group speed. A wave can be considered to be split into two parts; a series of oscillations, and an envelope, which dictates which of these oscillations can currently be seen. In the below left figure, the series of oscillations are depicted as solid lines (blue and red for the two pulses A and B respectively), and the envelopes are depicted as dashed lines (again, blue and red). The oscillations move at the phase speed, whereas the envelope moves at the group speed. The phase and group speeds can be very different. Again considering the below left figure, the vertical lines represent peak positions. The dashed vertical lines represent the envelope peaks of their respective waves (blue A, red B); the group speed is slow in this case, so over a short distance, the envelope moves a lot in time. The phase speed is fast in this case, so the oscillations move very little - they only appear to move as the envelope slides over them. The solid vertical lines represent the same oscillation peak (blue A, red B). The peaks are very close in time, as the phase speed is fast. As the speed difference with the group speed is considerable, the peak has however moved quite a distance within the envelope.
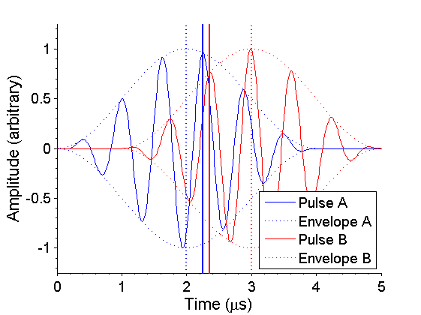
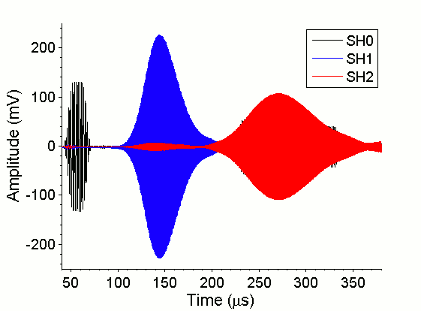
The left figure compares the phase and group speeds for an example pulse measured at two different positions (A and B). The right figure depicts experimental data for SH0, SH1, and SH2 wave modes. Not only is the frequency higher for each higher mode, but the group speed is slower for each higher mode (hence the envelope appears later in time even though the measurements were made at the same position), and the phase speed is higher as well.
How is the direction of SH waves changed?
The alternating nature of the magnet array used (in an EMAT) to generate the SH waves means that the frequency of the waves changes with angle. Considering the figure below, for a given angle, the waves generated by two adjacent but oppositely polarised points is in phase if the difference in propagation distance is half a wavelength. A PPM EMAT has more than two elements, so the overall result is a sum of multiple elements acting in this fashion. If the EMAT is given a short pulse of current, this will mean that the ultrasound pulse generated will have a different frequency depending on the propagation direction. However, if the EMAT is given a single frequency signal, the wavefronts generated by the oppositely polarised EMAT elements will destructively interfere except at a particular angle. Therefore, the SH waves can be electronically steered in a certain direction merely by changing the excitation frequency.
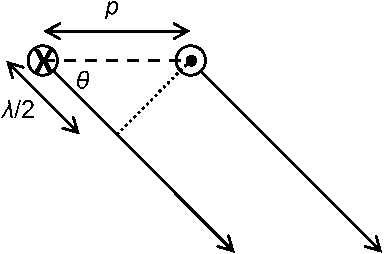
This picture depicts oppositely polarised PPM EMAT elements, which produce wave fronts that are in phase at an angle for which the difference in propagation distance is half a wavelength.
 "ePortfolio - Phil Petcher" by Phillip A. Petcher is licensed under a Creative Commons Attribution 3.0 Unported License.