
Thickness Gauging
Introduction
The most simple application for EMATs is thickness gauging and they have been commercially used in such areas as steel boiler pipe and petrochemical pipe inspection (for more detailed information on these areas see EMATs section).
We have developed a non-contact technique capable of measuring the thickness of moving or hot aluminium sheet that is more accurate than the measurement obtained using a digital micrometer in a static test.
Aluminium sheet is used in a wide range of devices and products from sports cars to beverage cans. Accurate control of the thickness is not only of great manufacturing cost benefit but will also lead to improved product safety, reduced wastage and increased manufacturing efficiency throughout the supply chain.
The technique that we have developed is an ultrasonic thickness gauging approach that employs a non-contact device called an Electromagnetic Acoustic Transducer (see EMAT section). The EMAT is used to generate and receive broadband (very ‘sharp’ signals in the time domain) ultrasonic waves in metals and is particularly efficient when operating on aluminium. In order to achieve these results we have used a combination of highly specialised hardware coupled together with mathematical analysis of the waveform using an algorithm called a Fast Fourier Transform (FFT). Using our approach it is possible to measure the thickness of aluminium sheet to within sub-micron accuracy [1].
What sensors do we use and why do we use them?
Ultrasonic thickness gauging is typically performed using contact piezoelectric transducers for a wide range of materials and is a well-established technique [2]. Electromagnetic Acoustic Transducers (EMATs) have been used sporadically in thickness gauging applications for over 25 years. To date, EMATs are not widely used as historically they have been large bulky devices only capable of operating at low frequencies (below 1MHz). The advent of small, high field, rare-earth permanent magnets has meant that EMATs can now be manufactured without the need for an electromagnet and are now comparable in size to conventional contact transducers.

Figure 1
Ultrasound is coupled through to the sample from the transducer, usually by a gel. The ultrasonic wave is reflected from the opposite face of the sample and some is coupled back through to the transducer.
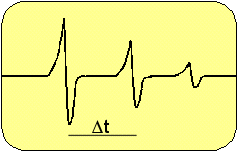
Figure 2
Ultrasonic waves reverberate between the two outer faces of the sample and an exponentially decaying echo train is detected as shown above. The time between 2 consecutive signals corresponds to the distance travelled in one ‘round trip’ i.e. two plate thicknesses.
In most metals the shear wave EMAT has the advantage that the shear wave travels at roughly half the longitudinal wave velocity and thus the first shear wave arrival has roughly double the transit time of a longitudinal wave in the same sample. Higher accuracy can be obtained measuring the shear wave rather than the longitudinal wave as the shear wave has a much longer transit time and hence the absolute temporal measurement error is roughly half for the shear wave.
Benefits of using EMATs
-
Non-contact making online inspection more practical. (see figure 3)
-
Only single sided access is required.
-
EMATs are electromagnetically coupled and are thus insensitive to misalignment.
-
Electromagnetic coupling allows a more rapid test (no delay through contacting couplant liquid)– important on moving samples.
-
Broadband high frequency devices giving high measurement resolution.
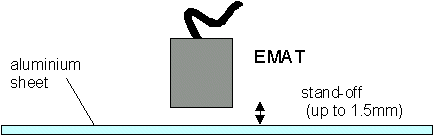
Figure 3
Schematic diagram showing the set-up used in the EMAT thickness gauging technique.
What do we measure?
Consider a wave with amplitude 'E1' and angular frequency 'w' travelling through the aluminium sheet in the direction of increasing distance ‘z’. Such a wave can be described by the exponential function for the displacement
w1 = E1 exp { i ( kz - wt ) } (equn. 1)
Where t is time and k is the wavenumber (2 p / wavelength). µ
And similarly the displacement ‘x2’ of a wave travelling in the opposite direction can be written as:-
w2 = E2 exp { -i ( kz +wt ) } (equn. 2)
Note that we have not defined the displacement as a shear of longitudinal wave displacement and the expressions are general and apply to either case.
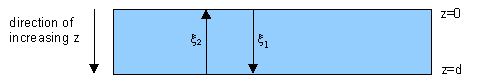
Figure 4
Schematic diagram of waves in thin sheet.
The boundary conditions are that the aluminium-air boundary is stress free as the plate is unconstrained. The waves add linearly and we chose the first aluminium-air interface to be at z=0 and the other to be at z=d, where d is the thickness of the sheet as shown below in figure 12. The stress at a general position z is given by a summation of the stresses due to each wave such that:-
Where r is the material density, stress (s) associated with x1 is given by:-
s= r . (w/ k)^2 . dx1/ dz (equn. 3)
As the total stress (sum due to each wave) must be zero at each boundary (z=0 and z=d) for all values of t we obtain
E1 = E2 (from boundary condition at z=0) (equn. 4)
Thus at z=d we obtain:-
exp { ikd} = exp { -ikd} (equn. 5)
hence,
exp {2ikd} = 1 (equn. 6)
The solution to this final equation is w=npv/d (where n is an integer, v is the wave velocity) as before. Thus we have a more ‘formal’ explanation of why the resonant peaks occur at specific values within a Fourier transform of the ultrasonic echo train.
Magnitude Fourier transforms of the ultrasonic waveforms in thin sheet
Prior to performing the Fast Fourier Transform (FFT) the data is windowed starting from a point one microsecond after the generation pulse to a point where the average peak amplitude falls to a value below 10% of its maximum value. Ignoring data before one microsecond ensures that the ‘dead-time’ region is not transformed as it contains no useful information, and ignoring data below 10% of the maximum amplitude value ensures that there is sufficiently high signal to noise in the data that is transformed. The particular region windowed (1-20?s) for the transform is arbitrary but it has been used consistently throughout the data presented here. Prior to performing the FFT, a Hanning window is applied to the data and the data is ‘padded-out’ with null points. Padding out the data prior to a transform increases the resolution of the resultant FFT.
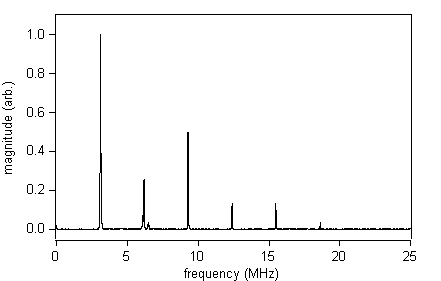
Figure 5
Normalised magnitude FFT of the standard broadband shear wave EMAT waveform captured on the 500mm thick sample.
On closer examination it is evident that each of the peaks in the transform has a more complicated structure. Examining the fifth peak of the FFT for the 500mm thick sample (figure 5) it can clearly be seen that there are actually 2 overlapping peaks centred on 15.5MHz. This is because the aluminium is mildly anisotropic and therefore acoustically birefringent due to microscopic changes effected in the crystallographic structure of the metal during the rolling process. The net result is that for normal incidence shear waves the energy is guided into 2 discrete orthogonal polarisation directions, each with a slightly different ultrasonic velocity. Thus the ‘repeat’ frequency for each shear wave pulse will be slightly different and they will be more clearly separated in the transform at higher frequencies.
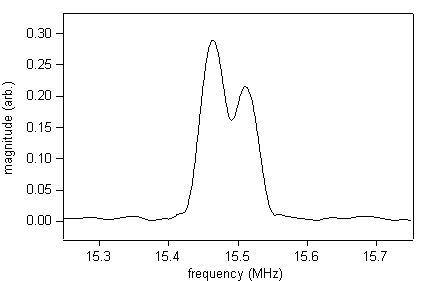
Figure 6
‘Zoom-in’ of the fifth peak in the FFT of the wider bandwidth broadband shear wave EMAT waveform captured on the 500mm thick sample.
In order to demonstrate the sub-micron accuracy it was necessary to measure samples with slightly different thicknesses but the same composition and rolling conditions. It was assumed that the shear wave velocities (or texture) for each of these samples would be nominally identical. The samples were measured with a micrometer and the average thickness of each was found to be 279.3mm, 277.4mm and 277.2mm +/- 1mm in each case. The FFT for each ultrasonic waveform captured on these samples is shown in figure 7. The samples measured using a digital micrometer could not be sensibly differentiated but are clearly separated by the ultrasonic measurement.
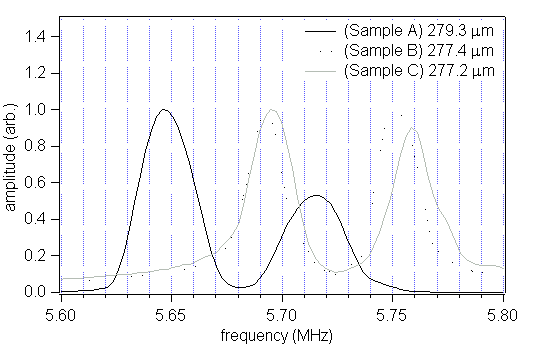
Figure 7
The first peaks in the FFT for the nominally 280mm thick samples. Note that the thickness values are calculated from averaged micrometer readings and that the ultrasonic measurements will actually yield more reliable thickness values.
What's next?
The next stage of this work is to try to implement the technology on-line as it is in a 'ready-to-go' state for use in the aluminium industry. Single shot data at stand-offs of over 1mm can be used to succesfully measure sheet thickness as shown below in figure 8.
The same technique can also be used to measure can wall thickness in formed cans, but as with any ultrasonic method the thickness accuracy obtained can only ever be as accurate as the callibration velocity. Some further work is required to obtain the same level of performance on steels as they are generally less efficient for EMAT operation.
We are also currently looking to develop a method for measuring the thickness of foils using EMATs to generate the anti-symmetic Lamb wave mode (similar EMAT system described in Anisotropic Texture section) and this approach looks very promising.
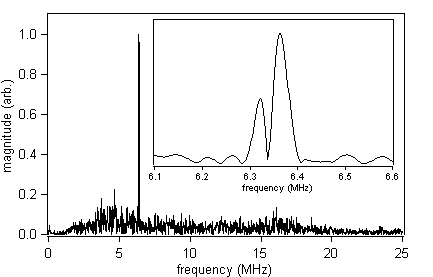
Figure 8
This FFT was obtained from a single waveform capture on the 250mm thick sample with an EMAT – sample separation of 1.5mm. A steel plate was positioned behind the sample to increase the magnetic field. The inset shows the double peak structure at around 6.35MHz.
References for further reading
[1]. Dixon S et al, High accuracy non-contact ultrasonic thickness gauging of aluminium sheet using Electromagnetic Acoustic Transducers (EMATs), Ultrasonics, 39, pp445-453, 2001
[2]. Dixon S, Edwards C and Palmer SB, Recent developments using ElectroMagnetic Acoustic Transducers, Insight, 44, pp274-278, 2002