
WBS UK Probabilistic Forecasts, Feb 2018
The figure below presents WBS's latest (as of 22nd February 2018) probabilistic forecasts for real GDP growth and inflation - for 2018 and 2019 - as histograms.
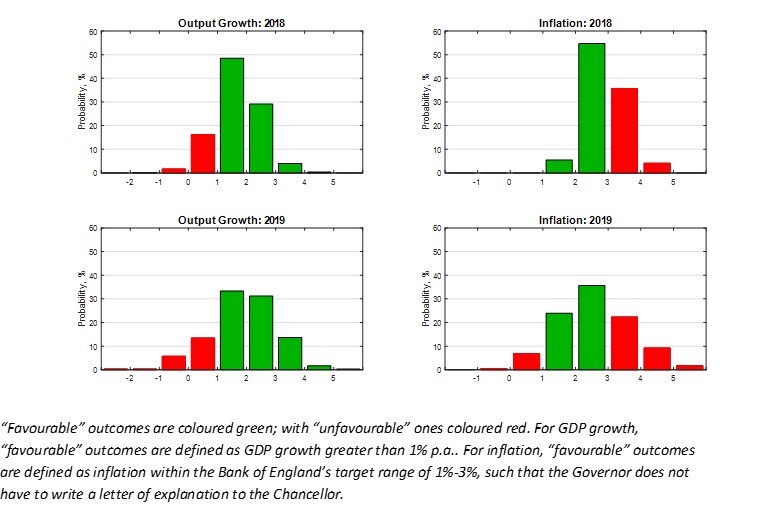
Conditioning on the latest GDP data from the ONS for 2017Q4, both the figure and Table 1 below reveal that the most likely outcome is that economic growth is between 1% and 2% in 2018. But, indicating some upside potential, the probability of growth greater than 2% is higher than the probability of growth being less than 1%.
Economic growth prospects for 2019 are more uncertain; growth between 1% and 2% is still the most likely outcome, but there is a higher probability of stronger growth. There is a 47% chance of growth greater than 2% in 2019 relative to only a 33% chance of growth greater than 2% in 2018.
Relative to our forecasts made one quarter ago, inflation risks have risen for 2018. There is now a 40% chance that inflation exceeds 3% in 2018 relative to a 27% chance forecast one quarter ago. There also remains a 33% chance that inflation persists and exceeds 3% in 2019. But inflationary prospects are forecast to be more evenly balanced for 2019, with a near equal chance of inflation falling between 1% and 2%, and 3% and 4%.
Table 1: Probability Event Forecasts for Annualised % Real GDP Growth and CPI Inflation
Year |
Real GDP Growth (%, p.a.) |
CPI Inflation (%, p.a.) |
||||
|
|
Prob(growth<0%) |
Prob(growth<1%) |
Prob(growth<2%) |
Prob(letter) |
Prob(CPI<1%) |
Prob(CPI>3%) |
2018 |
2% |
18% |
67% |
40% |
<1% |
40% |
2019 |
6% |
20% |
53% |
40% |
7% |
33% |
Comparison with other forecasters
The main objective of the WBS forecasting system is to provide benchmark and judgement-free probability forecasts; and to assess the risks associated with other forecasts.
Accordingly, we take the most recent point forecasts from the Bank of England, the IMF and the OECD.
We use the WBS forecasting system histograms to compute the probability that GDP growth or inflation is greater than the other forecaster’s “point” forecast. If the point forecast from the other forecaster falls in the centre of the WBS forecast distribution we would expect this probability to be 50%. On the other hand, if the forecaster is more optimistic (pessimistic) than we suggest they should have a probability less (greater) than 50%.
Table 2: Forecast Comparison for 2018
|
|
Real GDP Growth (%, p.a.) |
CPI Inflation (%, p.a.) |
||
|
|
Point Forecast |
Prob. of a higher outturn |
Point Forecast |
Prob. of a higher outturn |
Bank of England[1] |
1.87 |
40% |
2.49 |
77% |
IMF |
1.50 |
59% |
2.60 |
70% |
OECD |
1.20 |
74% |
2.60 |
70% |
Table 3: Forecast Comparison for 2019
|
|
Real GDP Growth (%, p.a.) |
CPI Inflation (%, p.a.) |
||
|
|
Point Forecast |
Prob. of a higher outturn |
Point Forecast |
Prob. of a higher outturn |
Bank of England1 |
1.79 |
55% |
2.18 |
62% |
IMF |
1.50 |
62% |
2.20 |
61% |
OECD |
1.10 |
78% |
2.20 |
61% |
Table 2 shows that while the Bank of England is more optimistic than the WBSFS about GDP growth in 2018, the IMF and OECD are more pessimistic. But looking further ahead to 2019 we see that all three forecasters, especially the OECD, are more pessimistic about GDP growth prospects than the WBSFS.
The WBSFS also suggests that the Bank of England, IMF and OECD think inflation will come down more quickly. In both 2018 and 2019 the WBSFS suggests that there is a greater than 50% chance that inflation exceeds their forecasts.
Note on the Warwick Business School Forecasting System
The Warwick Business School Forecasting System communicates forecast uncertainties for UK GDP growth and inflation in an open and transparent way – free from judgement. The system involves consideration of a range of cutting-edge econometric forecasting models, as opposed to relying on a single model which is likely misspecified.
Focus is on the production and publication of accurate probabilistic forecasts, using statistical methods, rather than constructing a narrative or story around one particular, but likely far from certain, possible set of outturns.
The WBS forecasts thus emphasise forecast uncertainties; and provide a benchmark against which one can assess the plausibility of other forecasts.
[1] The Bank of England (mean) forecasts for calendar year inflation are derived from their published forecasts for the four-quarter inflation rate and are, therefore, to be treated as approximate.