
Data load Control Chart
- Overview
As part of it's program of service management IT Services is using control charts as one of a number of tools to manage processes variations and identify assignable causes of process degradation or improvement. A brief overview of control charts can be found by clicking here
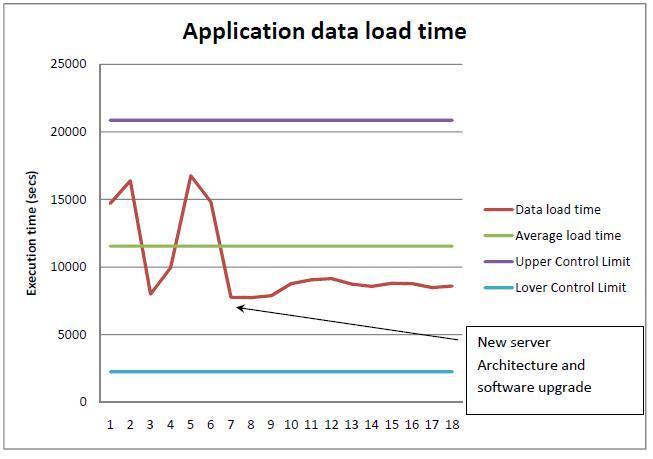
The run chart below charts execution time for the overnight application data load from SITS to the data warehouse. The control chart shows an assignable cause at point 7, which was the first run of the application data load process using the new Cognos software and server configuration.
The initial data points for the new architecture suggest that the average load time for the process may have re-centred and that the variability of the process has been reduced, however there is not enough data at this point to confirm this. This chart will be re-plotted on the 20th of October to verify the change
Benefit
If the process continues to show reduced variability the benefit realised is a reduction in the number of errors when creating the application data cube, currently there were six such errors in the preceding three months.
Further Data Analysis
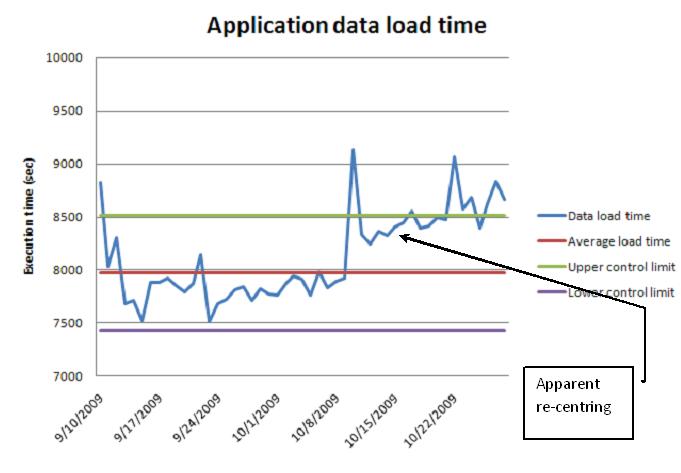
Further analysis of the data load process is shown below, an important point to note is that the execution time axis does not have an orgin of zero. The control chart seems to indicate that the process variability is reduced but the that average execution time is re-centering. Initial analysis of the data load process has indicates an approximate 10% growth in the data set being processed.
Follow up work on this trend has been undertaken see the page Data Load Metrics . This contains further analysis to normalise the performance based on the amiunt of work undertaken by a job.